

Overview
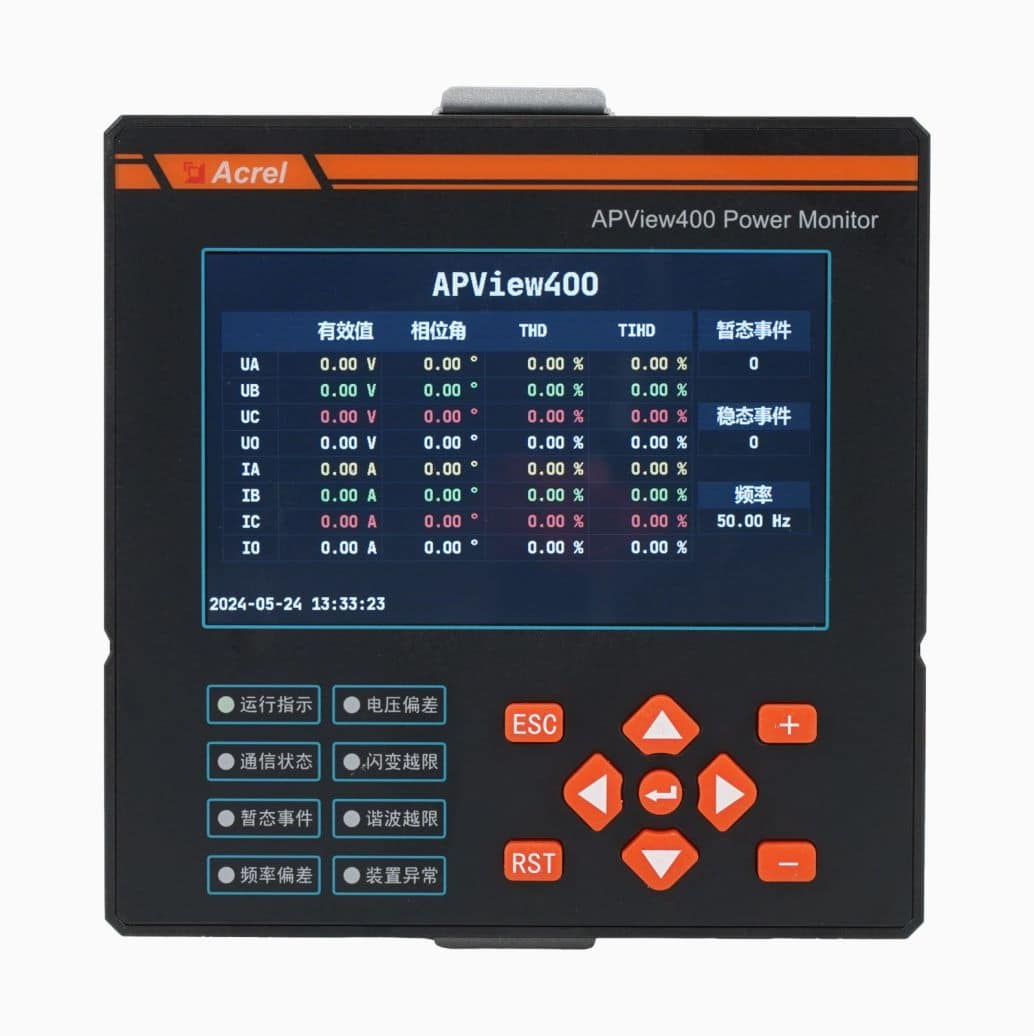
The APView350 is a high-end power quality monitor specially designed for renewable energy generation systems, strictly complying with IEC 61000-4-30 Class A standards. It integrates energy metering and power quality analysis into one device, featuring not only complete power quality analysis functions including harmonic analysis, voltage sag/swell/interruption, flicker monitoring, and voltage unbalance monitoring, but also advanced metering functions such as demand and time-of-use (TOU) metering. It meets the grid-connection monitoring requirements of 10kV and below renewable energy systems including photovoltaic, energy storage, and wind power. The device adopts a high-performance multi-core platform and embedded operating system, with a high sampling rate of 1024 points per cycle ensuring accurate and reliable data acquisition.
Highlight
Class A Accuracy & High-Performance Hardware
- 1024 pts/cycle sampling
- 32GB SSD storage
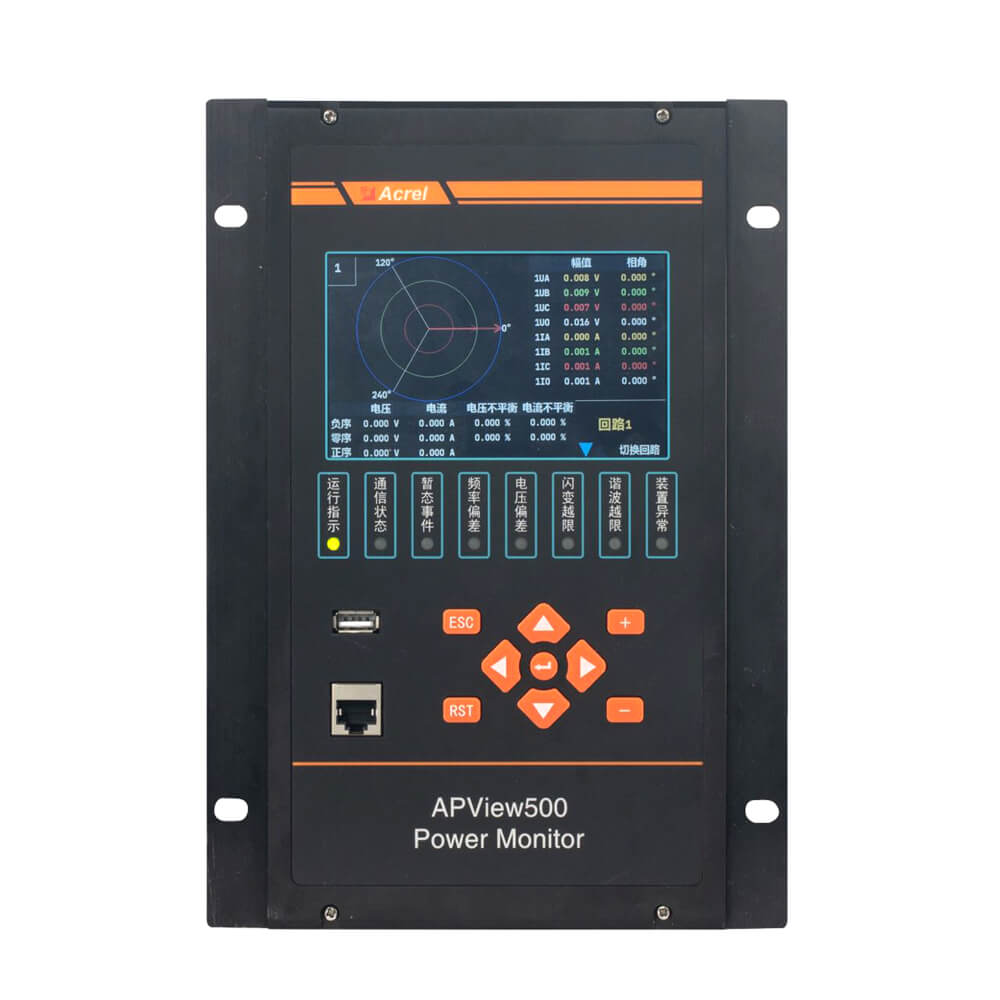
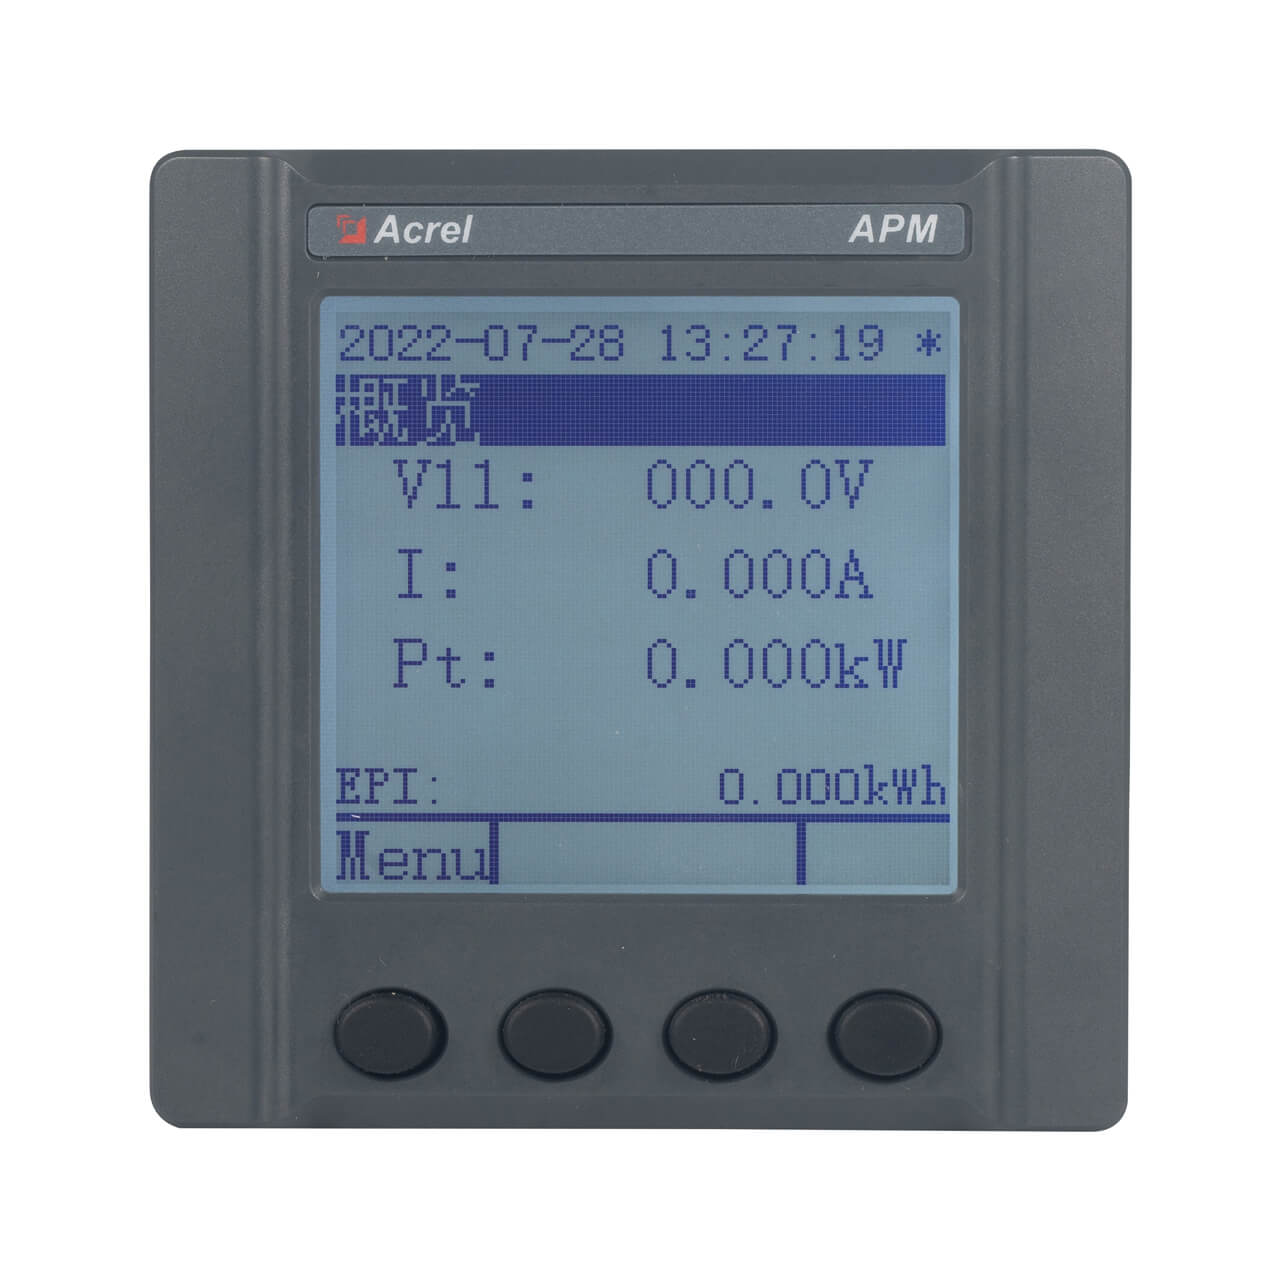
- 4.3″ color LCD display
Comprehensive Power Quality Analysis
- 2nd-63rd harmonics/interharmonics
- Voltage swell/dip/interruption
- Flicker/fluctuation/unbalance
Advanced Metering Functions
- Multi-rate energy (4 tariffs)
- Demand (real-time/max)
- Delta energy recording
Abundant Communication Interfaces
- 2 RS485 + 2 Ethernet ports
- Support IEC61850/Modbus
- IRIG-B hard sync
Function
| Measurement | Metering | Others |
| V/I RMS | Forward/Reverse Active/Reactive Energy | 5000 steady events |
| Frequency/Deviation | 4-Quadrant Reactive Energy | 5000 transient events |
| P, Q, S | Multi-rate Energy (4 tariffs) | 2000 fault waveforms |
| PF | Demand (real-time/max) | Fault recording |
| 2nd-63rd Harmonics/Interharmonics | Delta energy recording | Web Server access |
| V/I Unbalance | Timestamped monthly extremes | 3 programmable DO |
| Flicker/Fluctuation | 31-day daily frozen energy | 5 active DI |
| Swell/Dip/Interruption | 12-month historical data | 2 pulse outputs |
| Inrush current | 2 RS485 + 2 Ethernet | |
| DC component | IEC61850, Modbus-RTU/TCP | |
| RVC | PQDIF generation |
Show More
Specification
| Parameter | Specification |
| AC Voltage | Rated: 57.74V/100V or 220V/380V Overload: 1.2× cont., 4× for 1s |
| AC Current | Rated: 5A Overload: 1.2× cont., 20× for 1s |
| Accuracy | V/I: Class 0.1 Active Energy: Class 0.2 Reactive Energy: Class 0.5 Freq. Dev.: ±0.001Hz |
| Harmonic Accuracy | Meets IEC 61000-4-30 Class A Accuracy: ±5% (UhN ≥ 1% Un) / ±0.05% (UhN < 1% Un) |
| Transient Accuracy | Amplitude Error: < ±0.2% Time Error: < ±20ms |
| Auxiliary Power | AC/DC 110V / 220V or DC 24V/48V Consumption: ≤15W |
| Operating Environment | Temp: -10℃~+55℃ Humidity: 5%~95% non-cond. Altitude: ≤2500m |
| Digital Input | 5 ch, active (ext. power required) |
| Digital Output | 3 ch, programmable relay |
| Communication | 2x RS485 (Modbus-RTU, IRIG-B) 2x Ethernet (Modbus-TCP, IEC61850, FTP, Web) |
| Pulse Output | 2 energy pulse outputs |
| Maintenance | 1x USB |
| Dimensions | Main: 190mm × 156mm × 171mm (W×H×D) |
| Mounting | Embedded (Cut-out: 181mm × 144mm) |
Show More
FAQ
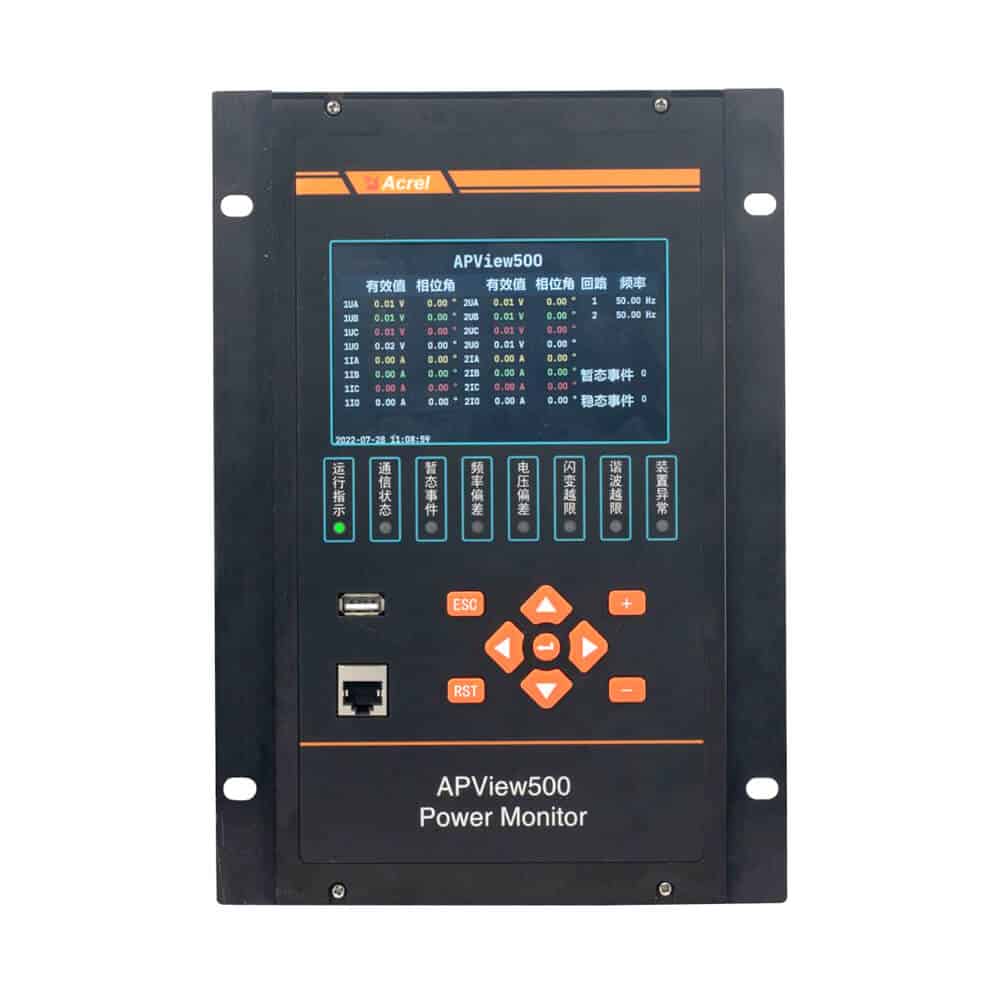
APView350 is specially designed for renewable energy systems (PV, storage, wind power), integrating advanced metering functions such as multi-rate and demand on top of power quality analysis, suitable for 10kV and below systems. APView500 features a dual-circuit design for simultaneous monitoring of two independent incoming lines, suitable for high-reliability scenarios like data centers and hospitals. They have different positioning and can be selected based on application scenarios.
Multi-rate schedules must be configured via the device’s Web interface. It supports 8 independent schedules, with 8 season schedules (up to 16 seasons/schedule) and 8 time schedules (up to 16 periods/schedule). Rates can be set separately for workdays, weekends, special days, and other days. Once configured, the device automatically accumulates energy according to the set rate periods.
The APView350 can store 5000 steady events, 5000 transient events, and 2000 fault waveforms. Steady-state 1-minute statistics can be stored for up to 90 days (FIFO principle). The storage capacity meets long-term operational analysis needs.
Yes. The device provides 2 RS485 and 2 Ethernet ports, supporting standard communication protocols including IEC61850 and Modbus-RTU/TCP. It can be seamlessly integrated into PV monitoring systems, storage EMS, wind power SCADA platforms, etc., enabling data interoperability.
The dip/swell source location function is built into the device and requires no additional configuration. When a dip/swell event occurs, the device automatically records waveforms and electrical parameters, analyzing whether the disturbance source is on the line side or busbar side using the equivalent impedance method. Users can directly view location results in the event record interface, helping to clarify incident responsibility.
The demand period can be set in the “Parameters – Basic Parameters” menu. Optional demand periods include 5min, 10min, 15min, 30min, 60min, etc. Once configured, the device automatically calculates the average power within each demand period and records the monthly maximum demand with its timestamp.
Summary
With its Class A accuracy and integrated power quality & metering design, the APView350 provides a comprehensive grid-connection monitoring solution for renewable energy systems. It not only meets the stringent power quality monitoring requirements of 10kV and below photovoltaic, energy storage, and wind power systems, but also helps users achieve refined energy management through advanced metering functions including multi-rate and demand. Choosing APView350 means selecting a professional solution integrating power quality analysis, precision metering, and event traceability.